By the Numbers
Passenger Vessel Safety: a Quality Partnership between government and industry.
A regularly delivered collaborative document that – in our opinion – doesn’t get the attention (or praise) that it deserves, is the annual U.S. Coast Guard-Passenger Vessel Association Quality Partnership. The latest iteration of this valuable effort is a document that provides an overview of the U.S. flag, Inspected Passenger Vessel fleet, and related marine casualty and inspection information. The report covers calendar years 2021‐2023 and was developed from information contained in the U.S. Coast Guard Marine Information for Safety and Law Enforcement (MISLE) database.
It's been a while since MarineNews took a hard look at these numbers; actually, just over five years. We also have that analysis to look back upon and, because historical data is just as important as the current numbers, we have combined the two reports to create something of real value. So: how is the collective domestic passenger vessel industry doing in terms of safety? Read on – the numbers don’t lie.
The number of inspected passenger vessels again increased in 2023. Now exceeding pre-pandemic levels, these vessels continue to provide myriad areas of value to the domestic waterfront. From taking the traffic off the roads, to reducing airborne pollutants using increasingly ‘decarbonized’ hulls and increasing the ease of travel and mobility for the general public, ferries and passenger vessels remain as one of them most important parts of the domestic intermodal equation. And yet, challenges – especially in way of safety – remain.
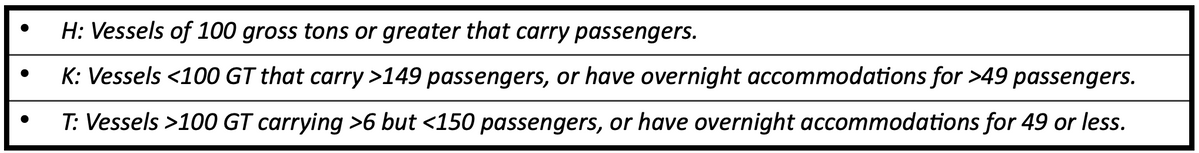
One area of continued concern is the high number of significant injuries for crewmembers and passengers caused by falls. In fact, it is this type of casualty that continues to be the leading cause of injuries on inspected passenger vessels. But, in order to fully understand the nature and make-up of the fleet, we need to first define what we are looking at. Inspected passenger vessels are regulated under Title 46, Code of Federal Regulations (CFR) Subchapters H, K, or T, as follows:
It is also instructive to look at the domestic passenger vessel fleet growth (or contraction) in terms of where we’ve been, and where we are going. In general terms, it can be seen that the fleet numbers have grown, but not by a huge percentage. That’s because, even with today’s aggressive fleet renewal programs underway, the new vessels being brought into service typically have more capacity, hence there is theoretically less need for more vessels. And yet, the 5% (315 vessels) growth over the past seven years is indicative of the increasing popularity of waterborne transit, urban commuters and everything in between. Actually, the one thing not addressed in the USCG/PVA joint report is the fleet’s average age. That number, and the trends looking back would be quite helpful in this type of analysis.
As indicated in Table 1 below, there are 6,694 inspected domestic passenger vessels. This is an increase of 315 vessels since the last report and is a positive sign for the industry – and for nation’s intermodal equation. The ACTIVE fleet, however, shows a lesser increase of 178 hulls, or an increase of 2.8% over a seven year period.
Table 1: Inspected Passenger Vessel Numbers: yesterday and today …
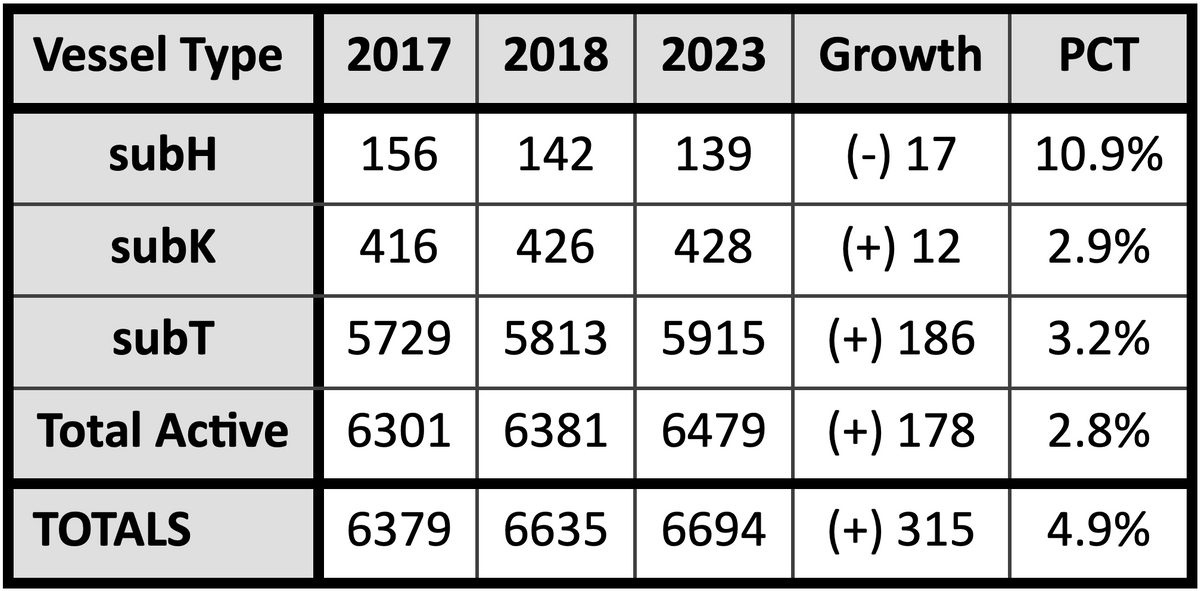
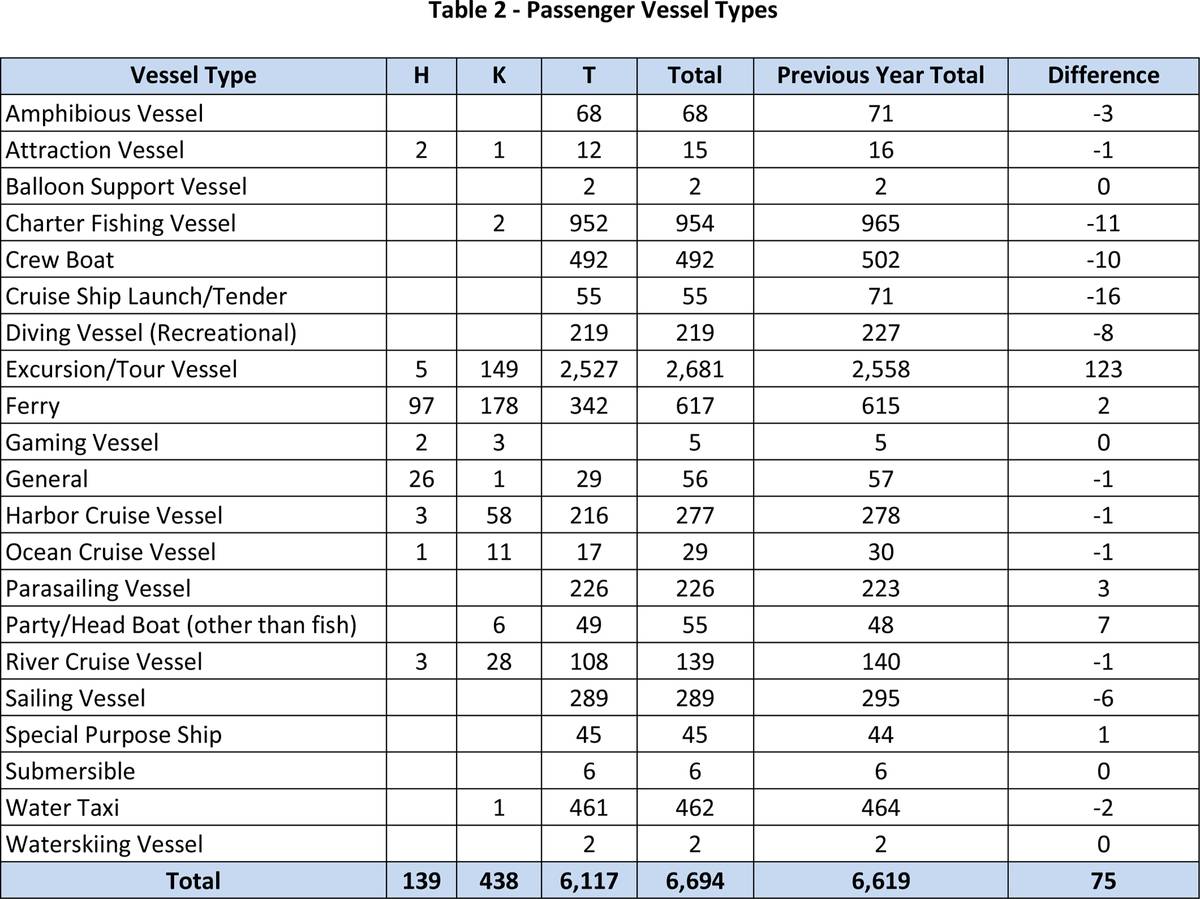
Table 2 shows the breakdown of Inspected Passenger Vessels by their Vessel Type. The biggest increase was in the “EXCURSION/TOUR VESSEL” category; 123 vessels. After several years of large decreases in the number of passenger vessels categorized as “GENERAL” in our MISLE database, industry has seen a plateau in the use of this category. CG-CVC continues to monitor the categorization of vessels in the system and works with local inspectors to find alternatives, where applicable. And, the vast differences in the types, uses and sizes of these vessels makes the passenger vessel industry one of the most diverse, and therefore challenging sectors of the marine markets to regulate. The 6,694 inspected passenger vessels from 2023 are classified into the following vessel types:
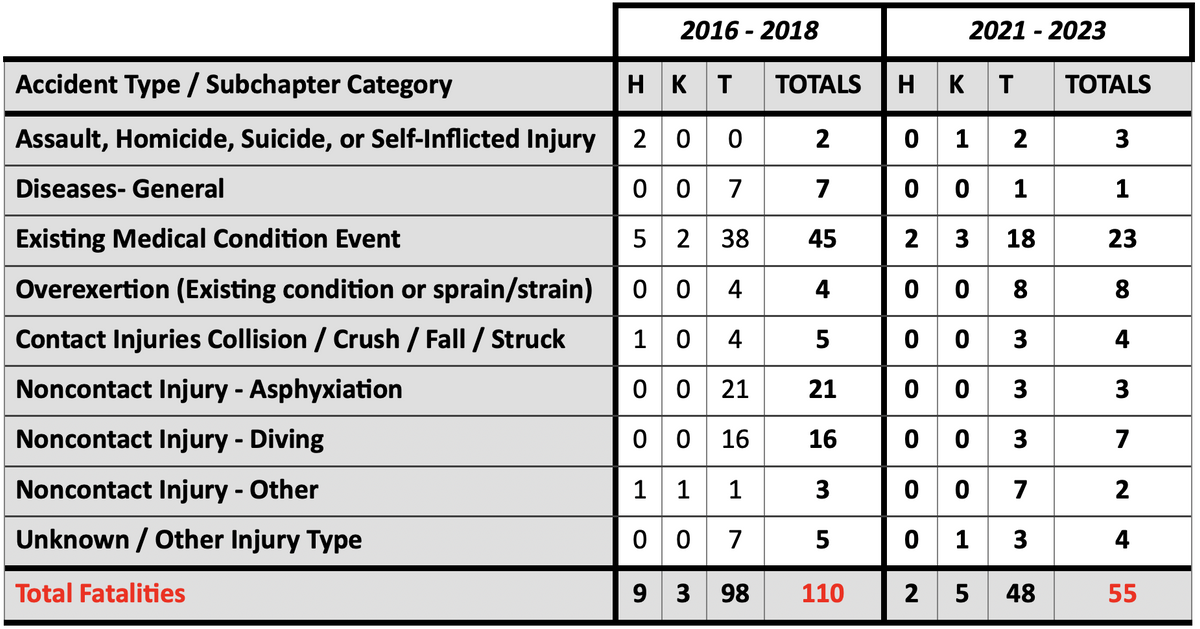
Within the most recent USCG-PVA Quality Partnership Annual Report (2021-2023), the authors point to continued improvement or stability in many of the key metrics relating to the domestic passenger vessel industry. For example, the report states, “The total number of fatalities has continued its sharp decline and has set another historical low at 55 in the past three years. Although three (3) of those fatalities were found to be operationally related, that again is a historical low.” The seven year average (and totals), shown in Table 3 below, show an even more dramatic improvement. And, while even one death is too many, the many millions of passenger embarkations experienced by domestic ferries and passenger vessels annually only underscores the excellent record in this sector.
Table 3 – Fatalities Involving Passenger Vessels … real progress on the water
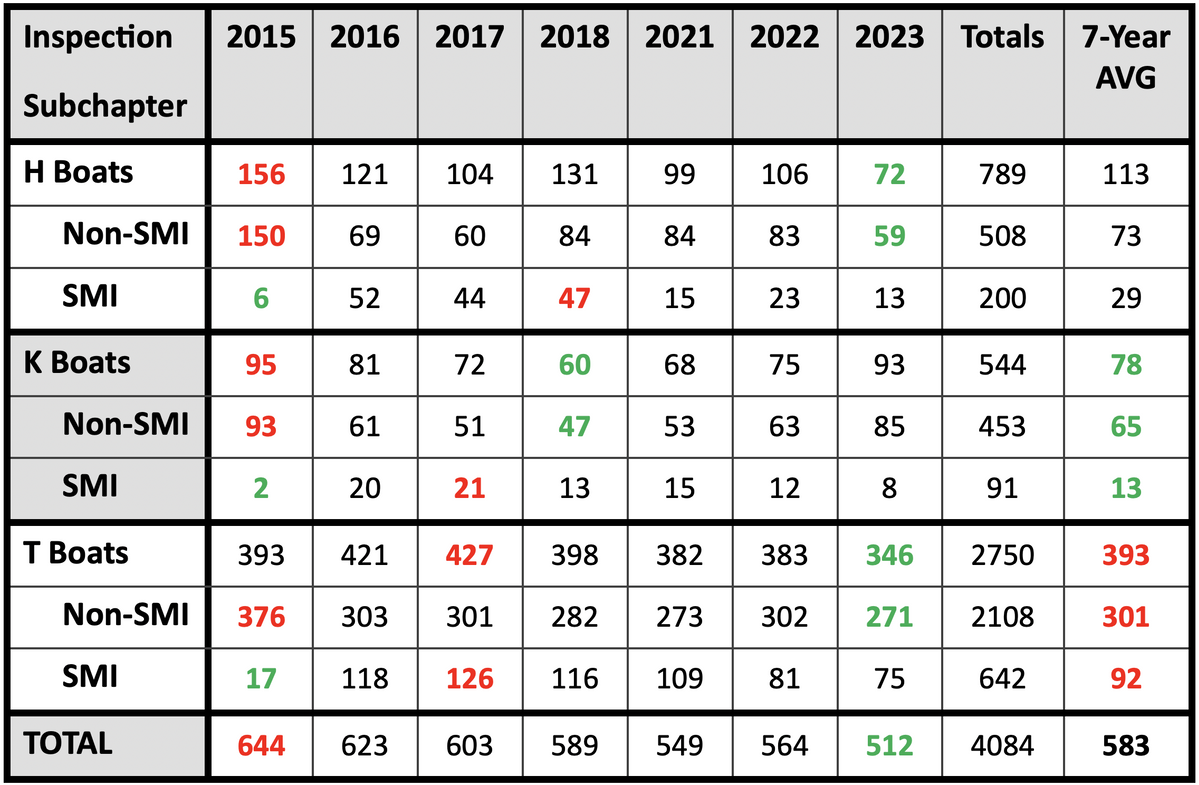
Reportable Marine Casualties Involving Inspected Passenger Vessels is another statistic that can be used as a valuable benchmark to determine progress being made (or not) for any dangerous industry. In Table 4 shown below, total reportable marine casualties are also broken down into those attributable to each class of passenger vessels. This is helpful is one is trying to determine the most likely cause of an accident, based on the type of hull it occurs on. In this case, we augmented the current report’s data with statistics compiled as far back as 2015. Hence, and while the 2021-2023 progression numbers tell a good story, a seven year average of improvements shows even more dramatic good news on that front.
In 2023, for example, the total number of reported casualties had decreased by a whopping 20 percent from that recorded in 2015. Moreover, that 2023 number (512 reportable casualties) is 12 percent less than the seven year running average. Good news indeed.
But what is a “non-SMI casualty?” A non-SMI marine casualty is a marine casualty that doesn't meet the threshold for a serious marine incident (SMI). The US Coast Guard (USCG) defines a marine casualty as any accident or event involving a vessel on the navigable waters of the United States. In Table 4 , we’ve highlighted (in RED) the high years for each category in terms of total casualties, as well as the lowest totals (in GREEN) to make the chart a bit more readable. And, as anyone can see, 2023 was the best year on record in terms of safety on the water for the Passenger Vessel Industry. And, while “T” boats would nominally seem to be the most unsafe in terms of total casualties, with “K” boats being the safest, that’s not necessarily true, since “T” boats make up fully 91% of the domestic passenger vessel fleet.
Table 4: Reportable Marine Casualties Involving Passenger Vessels (2015-to-2023)
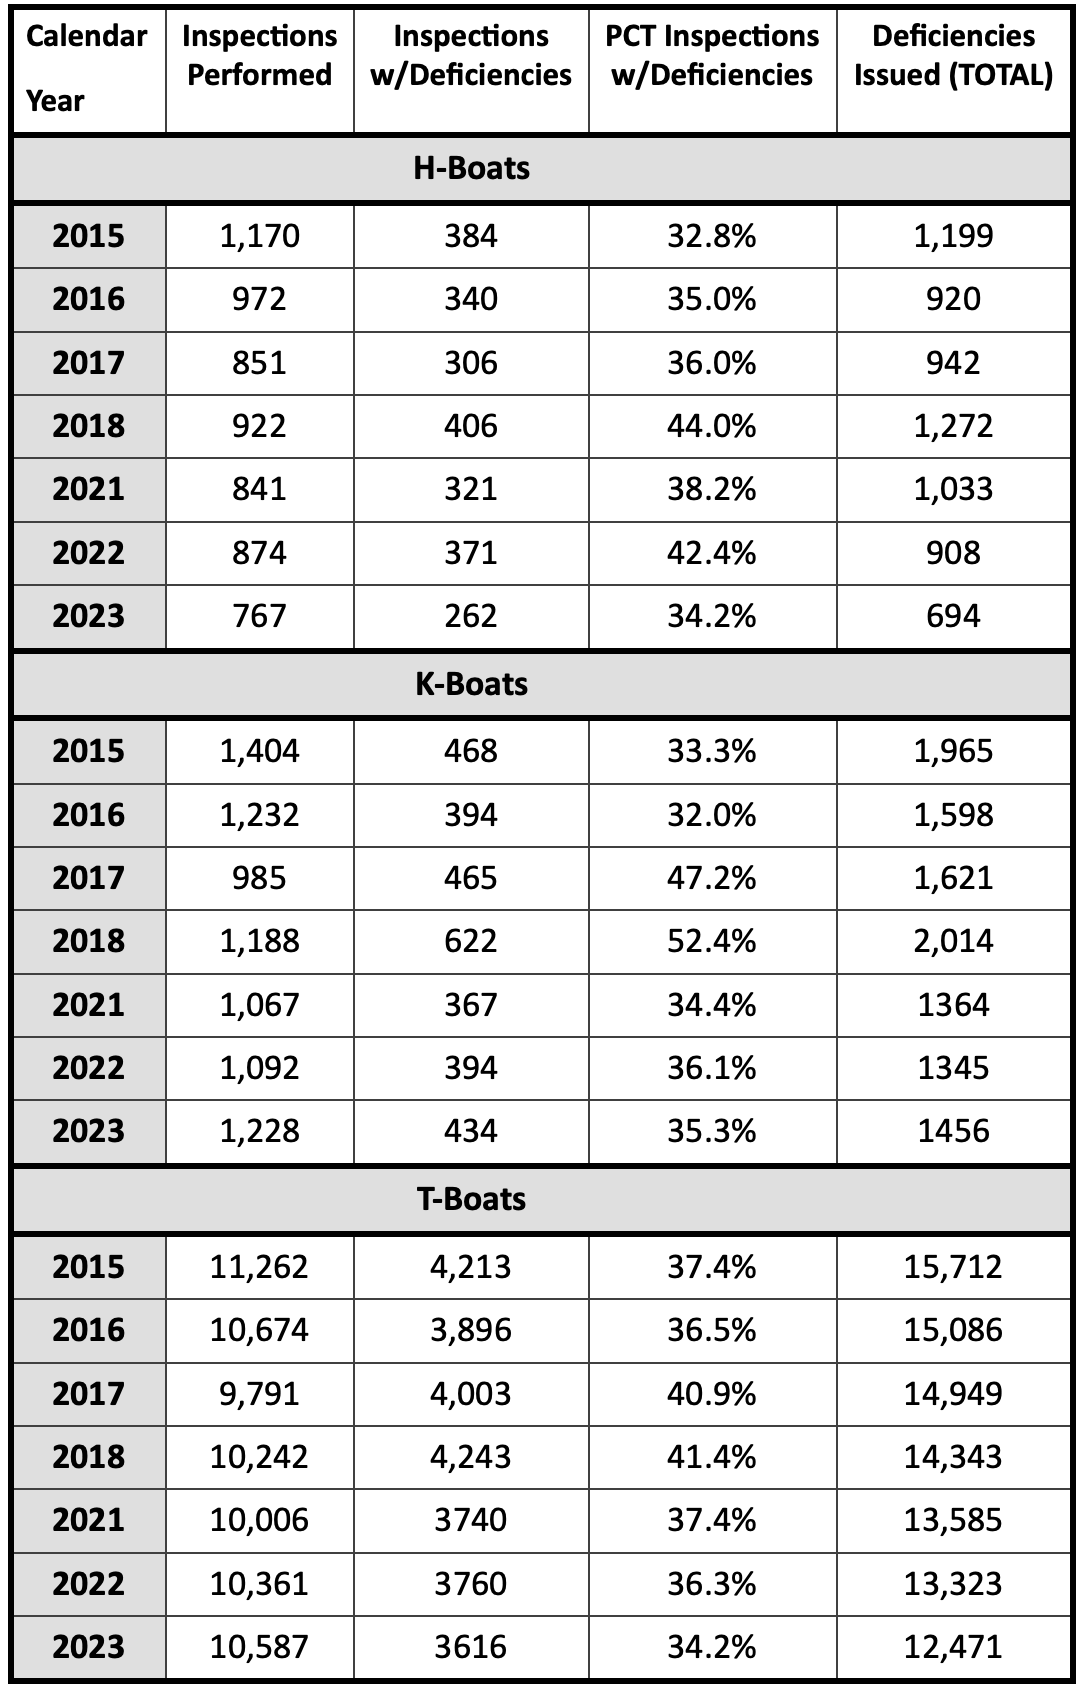
The majority of the passenger vessel inspections and deficiencies issued involved T-boats due to the size of that fleet. That should be no surprise. Perhaps, some better metrics to zero in on across the broad expanse of the topic of passenger vessel safety should involve (a.) the number of inspections performed in a given year – and over time as a trend – and (b.) the percent of inspections that resulted in deficiencies noted.
In 2015, for example, the Coast Guard performed 13,836 inspections on board passenger vessels. By 2023, that number had fallen drastically to 12,582 inspections, or a drop of more than 9%. MarineNews readers, of course, will remember that by 2015, the dreaded subchapter M towboat rules were in the final stages of promulgation. We cover that topic nicely in our December 2024 digital edition both in terms of similar statistics, but also a very fine overview by industry subject matter expert (Captain) Pat Folan.
You can link to the SubM By the Numbers Report HERE and Folan’s hard-hitting narrative HERE.
In any event, the shortage of qualified marine inspectors within the ranks of the nation’s fifth uniformed service was clear even back in 2015, and that gap has only been exacerbated by the addition of the SubM inspection duties to the already challenging multi-missioned nature of the Coast Guard’s wide swath of responsibilities.
The good news over this yawning seven year period of time is that the number of inspections that resulted in noted deficiencies (for the total, combined fleet) dropped slightly, from 36.6% to 34.3%. But we must ask ourselves: is this small improvement a function of a safer and better maintained fleet, or is merely a manifestation of an overworked, less-experienced Coast Guard marine inspection team, that has missed deficiencies in their haste to get the increasingly burdensome job done? The remarkable drop in fatalities (Table 3) over the same time frame would suggest the former. Still, the decrease of 1,254 annual inspections across this diverse fleet is worrisome. The Coast Guard recently – and for the first time in many years – made their recruiting goals. Let’s hope Curtis Bay transforms a large swath of those coasties into competent marine safety inspectors.
Table 5 shown below is an excellent window into the inspection and deficiencies window, with sub-categories per type of vessel broken out. We took the liberty of augmenting this year’s report with data dating back to 2015. At MarineNews; we’re helpful like that:
Table 5: Vessel USCG Inspections & Deficiencies (2015-2023)
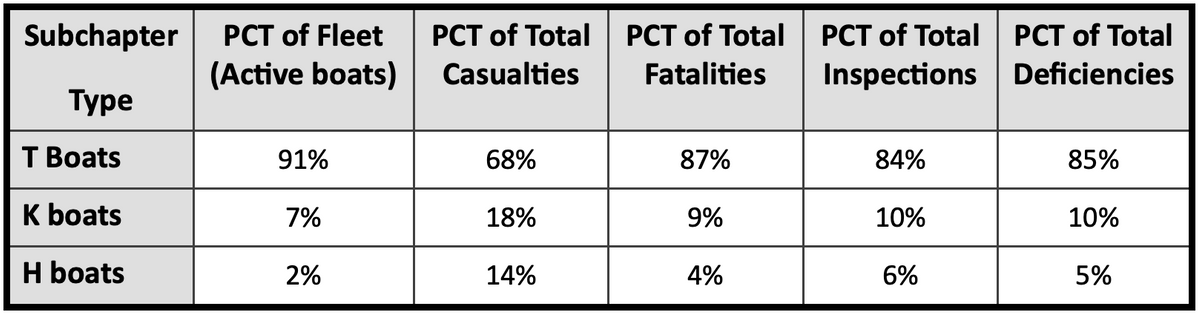
Digging still deeper into the topic of inspections, deficiencies, fatalities and everything else is also a worthwhile endeavor. That’s because it is unfair to benchmark safety performance in broad strokes, without defining the data sets – and their relative size – in relation to the raw numbers of incidents, etc. In Table 6 shown below, we show fleet safety performance spread out over the three types of passenger vessel categories, as a percentage of inspections, casualties, deficiencies and of course, the percent of the fleet each type of vessel represents.
In general terms, it might be said that the “T” boats outperform the others in all categories, despite representing 91% of the total fleet. But, that’s unfair to suppose linear relationships between all three categories, because the smaller the subset of data, the more room for anomalies will exist. Nevertheless, the data is worth a closer look.
Table 6: Distribution of Inspections, Deficiencies, Casualties & Fatalities by Subchapter class (7 year AVG)
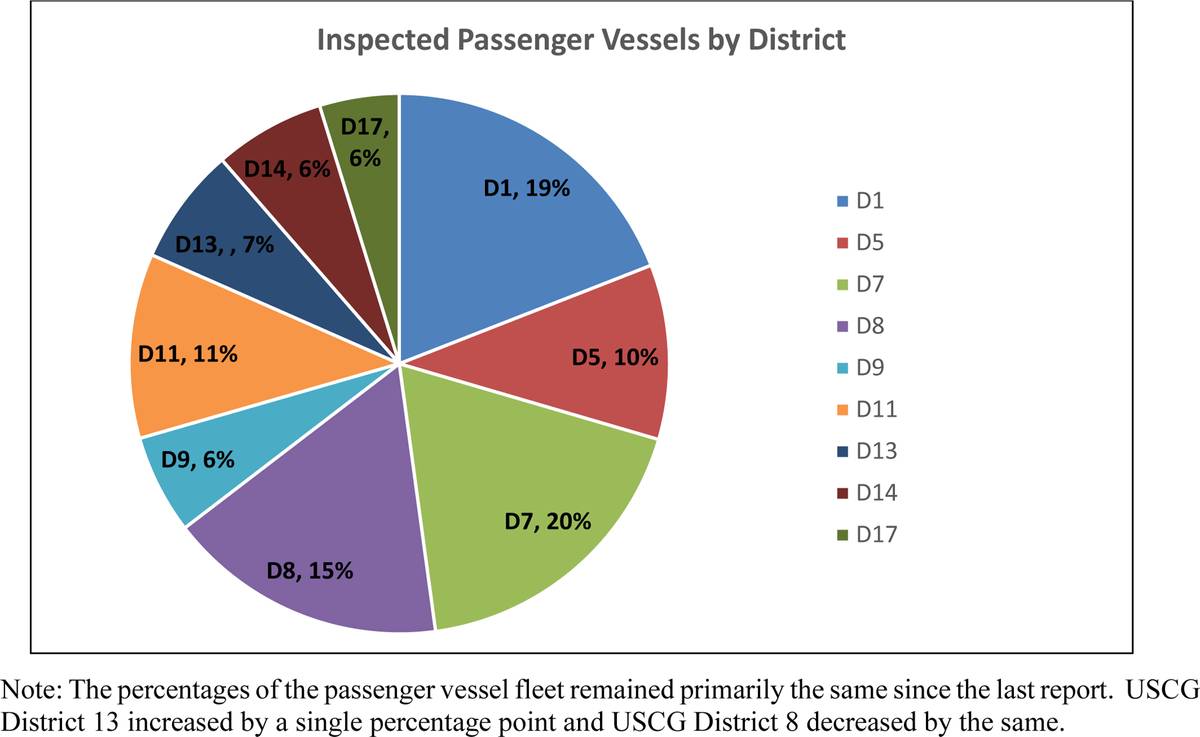
Finally, the far-flung and different Coast Guard sectors all have different exposures (and responsibilities to regulate) inspected passenger vessels. The percentages of the passenger vessel fleet remained primarily the same since the last report. USCG District 13 increased by a single percentage point and USCG District 8 decreased by the same. The pie chart shown below shows the breakdown of geographical locations of the total fleet. It goes without saying that those districts with higher exposure to the brown water fleet, especially towboats and subchapter M inspections, bear the greatest burdens. The pie chart shown below, taken directly from the USCG-PVA report, shows where the passenger vessels are more numerous, and where they are not.
The USCG-PVA Quality Partnership Annual Report (2021-2023) is a remarkable cornucopia of data sets, a document which dives much deeper into the topic of safety than does this article. Additional information and data for the passenger vessel sector, within that 20-page document, also includes, but is not limited to:
-
Initiating Events for Marine Casualties Involving Inspected Passenger Vessels;
-
Initiating Events for Serious Marine Incidents Involving Inspected Passenger Vessels;
-
The top 10 systems where deficiencies were identified and issued to inspected passenger vessels;
-
Vessel Deficiencies Issued to Inspected Passenger Vessels by System and Component;
-
Flag State Detentions involving Inspected Passenger Vessels;
-
Passenger Vessels Taking Part in the Streamlined Inspection Program (SIP); and
-
Enforcement Actions Resulting from Illegal Passenger Vessel Operations.
You can access that report HERE.
